Right after joining the NOC Tools team as a data scientist/data engineer role almost one year ago, I learned that monitoring would be an essential part of the roadmap. The goal for 2021 was to monitor each device’s health and performance on the field, on the exchange point, or in the customers’ offices and homes across the whole of Turkey. Of course, there is an ongoing monitoring system that handles all those operations and sends alerts to respondents. Yet, most of the parts of that system consist of outdated tools and legacy codes. So, I took the responsibility for every single part of which “data” is coming through or going out and managed to replace oldies with newbies and also goodies.
One of the particular tasks I’ve done was collecting traffic stats of users from BNGs (Broadband Network Gateway). Most of the collectors can obtain traffic stats per user. However, in some cases, you would not like to let your devices to respond SNMP calls of collectors because of performance or privacy-related issues. So, that drives me to build a custom SNMP collector.
Simple Network Management Protocol (SNMP) is an Internet Standard protocol for collecting and organizing information about managed devices on IP networks and for modifying that information to change device behavior.
https://en.wikipedia.org/wiki/Simple_Network_Management_Protocol, Last access: 14.11.2021
In the early days, I learned that the network teams were using 2 methods to collect traffic stats and those are Pure SNMP or SNMP with Telegraf.
– Pure SNMP: It’s pure because we are just sending a few SNMP GET requests.
– SNMP with Telegraf: End-to-end solution for collecting both historical and real-time traffic stats. Please, check the link for further details (https://www.influxdata.com/blog/monitor-your-snmp-devices-with-telegraf/)
Since Telegraf wasn’t suitable for our needs, we decided to continue with pure SNMP calls. Those can be listed as:
- Get the list of all sessions on the devices.
- Get the ifindex of the user by using the user’s OID.
- Get traffic stats (ifOutOctets, ifInOctets) of the user by using ifindex.
Before falling into the rabbit hole, I’d like to share some insights about the former state. What I took over is a few bash scripts that use files as data storage and the runtime of the total process was more than 10 minutes whereas it should be 2-3 minutes. I/O operations and sequential calls for data collection seemed “the usual suspects” of unacceptable runtimes to me. So, I was focused on parallelization and handling I/O operations.
snmpbulkwalk was used to send requests and collect outputs. You may run it via the command below and get the output as follow.
# snmpbulkwalk documentation
snmpbulkwalk -v SNMP_VERSION \
-u USERNAME \
-l SECURITY_LEVEL \
-a AUTH_PROTOCOL \
-A AUTH_PROTOCOL_PASSPHRASE \
-x PRIVACY_PROTOCOL \
-X PRIVACY_PROTOCOL_PASSPHRASE \
IP_ADDRESS \
OID
-----
# example usage of snmpbulkwalk command to get list of all sessions on device
snmpbulkwalk -v 3 -u XXX -l authPriv -a md5 -A XXX -x des -X XXX X.X.X.X 1.3.6.1.4.1.9.9.150.1.1.3.1.2
# output
SNMPv2-SMI::enterprises.9.9.150.1.1.3.1.2.3246813 = STRING: "USER1@ISP.com"
SNMPv2-SMI::enterprises.9.9.150.1.1.3.1.2.3246933 = STRING: "USER2@ISP.com"
SNMPv2-SMI::enterprises.9.9.150.1.1.3.1.2.3247113 = STRING: "USER3@ISP.com"
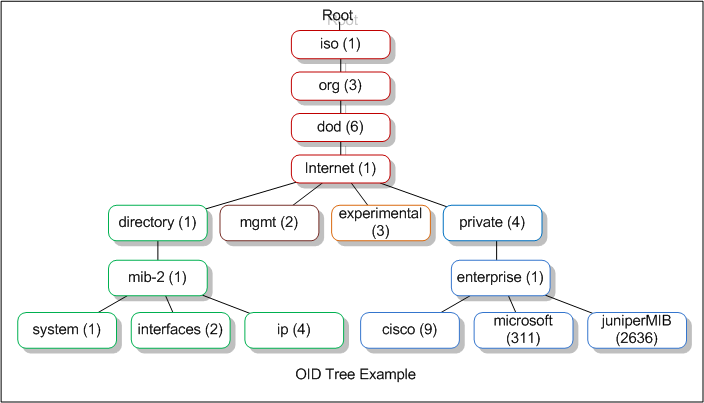
...There are some interesting points on both command and output. Let’s focus on the command first. As you can see, I’m using SNMP_VERSION = 3 which is far more secure than previous versions (Please check Cisco’s documentation about why to use SNMP v3: https://www.cisco.com/c/en/us/td/docs/ios-xml/ios/snmp/configuration/xe-3se/3850/snmp-xe-3se-3850-book/nm-snmp-snmpv3.pdf). Also, we are using a series of numbers split by dots, like an IP address from an exoplanet, which is OID (Object Identifier).
# example usage of snmpbulkwalk to get ifindex of a particular session
snmpbulkwalk -v 3 -u XXX -l authPriv -a md5 -A XXX -x des -X XXX X.X.X.X 1.3.6.1.4.1.9.9.150.1.1.3.1.8.3246813

# output
SNMPv2-SMI::enterprises.9.9.150.1.1.3.1.8.3246813 = INTEGER: 5421
To get ifindexes, you just need to change the OID of the previous command. IfIndex (Interface Index, please check for further details: https://www.cisco.com/c/en/us/support/docs/ip/simple-network-management-protocol-snmp/28420-ifIndex-Persistence.html) is used to specify the interface (might be physical or virtual, in our case virtual) of a particular session. So, we can say that USER1@ISP.com‘s session is on the interface whose index is 5421 at the X.X.X.X device.
# example usage of snmpbulkwalk to get traffic data of a particular interface
snmpbulkwalk -v 3 -u XXX -l authPriv -a md5 -A XXX -x des -X XXX X.X.X.X IF-MIB::ifInOctets.5421
snmpbulkwalk -v 3 -u XXX -l authPriv -a md5 -A XXX -x des -X XXX X.X.X.X IF-MIB::ifOutOctets.5421

# output
IF-MIB::ifInOctets.5421 = Counter32: 578684682
IF-MIB::ifOutOctets.5421 = Counter32: 1582316104
Finally, we have what we needed.. at least one of them. Now, the goal is to convert this set of commands to a python service and apply it to thousands of sessions.
Adapting those commands to python was relatively easy with the help of the pysnmp library and its well-written documentation. Especially, examples that cover both snmpwalk / snmpbulkwalk command pysnmp code together are decreased the development time significantly.
As I mentioned earlier, I planned a parallelization structure as follows:
- Parallelization of the 1st step: Each CPU core
- is going to fetch all sessions on a BNG.
- Parallelization of the 2nd step: Each CPU core
- knows OID and IP address of relevant BNG
- is going to get ifindex.
- Parallelization of the 3rd step: Each CPU core
- knows the ifindex and IP address of relevant BNG
- is going to get traffic stats.
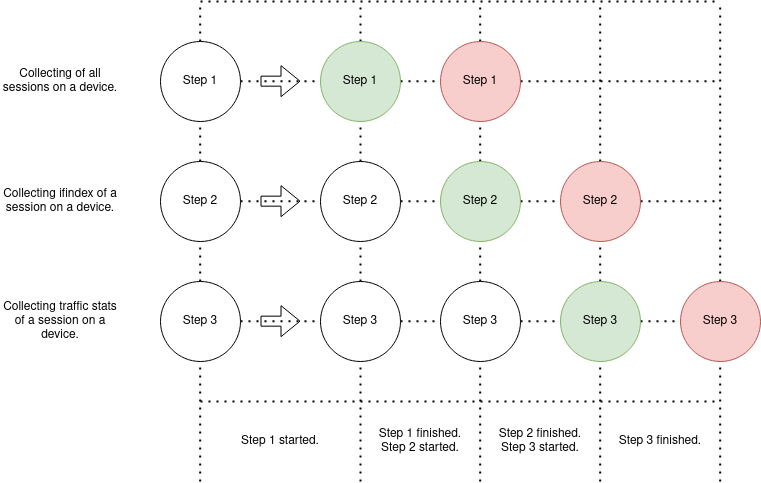
Unfortunately, all the given efforts in terms of parallelization didn’t end up with a crystal-clear solution. As can be seen from the diagram below, Step 2 has to wait until the completion of Step 1 and Step 3 waits for both Step 1 and Step 2.
After deploying this setup on an 8-core server, gathering traffic stats of 6k sessions from 600k total sessions on 40 BNGs finished in 2-3 minutes. On the contrary, with a fully sequential run, it was about 30 minutes.
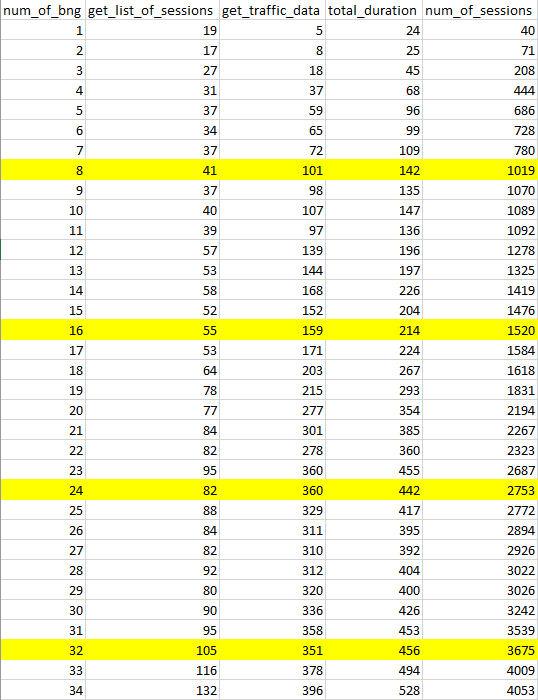
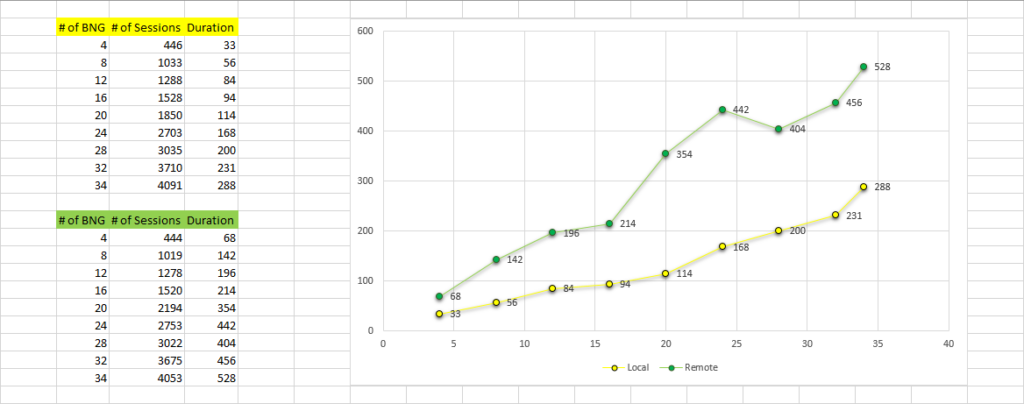
I prepared a benchmark to visualize the overall performance. Durations represent more than I mentioned because test runs are completed on a different setup and that causes a network delay. In the production setup, those durations decreased to almost a quarter of the shown values. It can be seen in the second table.
num_of_bng: # of BNG
get_list_of_sessions: Duration to list all sessions in a BNG.
get_traffic_data: Duration to get ifIndex and traffic stats for selected sessions.
total_duration: Total duration of the process.
num_of_sessions: # of selected sessions to extract traffic stats.
At the end of the day, all the extracted stats were inserted into InfluxDB and visualized to help the network operations team in Grafana.