During my first few weeks of working at a TELCO company, I was tasked with handling RRD files. RRD’s (round-robin database) are data storage files containing time-series data with ranging resolutions. Because of the way data is stored in RRD files, the system storage footprint is always constant. I was responsible for reading the data stored in these RRD files, writing them into our company’s InfluxDB and monitoring the data values through Grafana.
Due to the nature of the formatting, directly opening an RRD file will not yield any legible results, as it contains binarized and encrypted text. Utilizing RRDtool, we’re able to read RRD files in a more understandable format. We install this tool via:
sudo apt install rrdtoolAfter installation, we’re able to get the dump of the RRD as an XML and write it as an output:
rrdtool dump [FILENAME].rrd > test.xml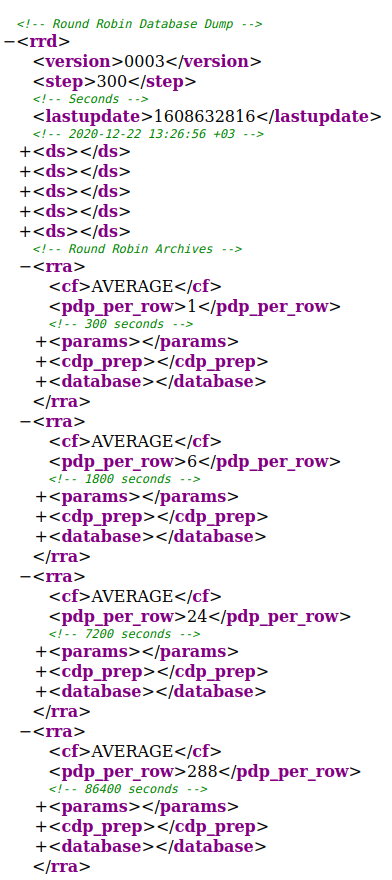
As shown on the right, the contents of the RRD file include definitions, values. The various time resolutions (300 seconds, 1800 seconds, 7200 seconds, etc.) are the time intervals, which are usually denoted as steps in most documentation. What this means is that if our step value is 300, then there are 300 seconds between each measurement.
The RRD file contains <cf> tags, which stand for consolidation function and will denote the operation that was made on the time-series data. The included functions are: AVERAGE, MIN, MAX, and LAST. For more on the consolidation functions, please refer to this source.
The <ds> tag represents the data source of the file. In the XML I’ve shown, we can see that there are 5 <ds> tags. When using a data source, more properties need to be specified. Further details can be found in the official RRDtool documentation.
And finally, we have the time-series data packed inside the database tag as follows:
<!-- 2020-12-16 07:30:00 +03 / 1608093000 -->
<row>
<v>0.0000000000e+00</v>
<v>1.1793301000e+01</v>
<v>1.4160830000e+01</v>
<v>1.3353590000e+00</v>
<v>9.5392500000e+00</v>
</row>
There are a limited number of lines in each resolution. For example, after 30 minutes have passed; the last line of the 1800 second step database will be replaced with a new entry. The newly inserted line is equivalent to 6 lines of the 300-second step database.
In my case, I needed to extract the last hour’s values of the AVERAGE cf in the 300-second step. In order to parse the RRD file to retrieve these values, I came up with two methods.
My first method was to parse the XML output itself, and the second was to use the Python binding, python-rrdtool. After experimenting and testing with both, using python-rrdtool ended up being much faster. As it yields far better results, I recommend that anyone wishing to parse RRD files use python-rrdtool.
The other two tools I utilized were InfluxDB and Grafana.
Grafana is an open-source tool, used mainly for analytics and visualization. It has incredible flexibility and is compatible with almost any time-series database. When building a monitoring stack, Grafana as the visualization component is always my go-to choice.
InfluxDB is an open-source time-series database that aims to handle large amounts of write and query loads. Written in the programming language Go, InfluxDB is widely used for purposes such as monitoring real-time analytics, IoT sensor data, application metrics.
I was able to set up both of these open-source tools with relative ease thanks to Docker. To obtain their images, simply use the following lines:
docker pull grafana/grafana
docker pull influxdb
After obtaining the images, we run the containers as follows (default options shown below):
docker run -d --name=grafana -p 3000:3000 grafana/grafana
docker run -d --name=influxdb -p 8086:8086 influxdb
Now that both of the containers are up and ready. It’s time to create a new database to insert metrics in. To achieve that, please follow the codes below.
docker exec -it influxdb bash
-->
influx
->
CREATE DATABASE pings;
USE pings;
CREATE USER data WITH PASSWORD 'data';
GRANT ALL ON pings TO data;
Initialization is completed. I have a table named as pings. I can reach it with the credentials that username:dataand password:data. Now, I may use the Python script that reads RRD file and insert the extracted values into InfluxDB.
I implemented other components to this stack, but due to confidentiality reasons, I’m unable to share the code itself as of now. But I am able to offer some tips that will definitely make your life easier when faced with these problems that I ran into.
- The RRD file doesn’t provide an explicit timestamp when parsing via Python. Therefore, you need to extract the starting or ending timestamp from the XML data. From there, you’re able to create a range by incrementing the extracted timestamp by the time step. (i.e. if your step is 300, then add/subtract 300 seconds from your timestamp incrementally)
- Convert timestamps to UTC to produce a better visualization and support various data source locations. After inserting into InfluxDB, you’re able to set timezones on Grafana to prevent any detrimental changes to your data.
- Write your insertion code as a function in order to use it frequently as needed.
After inserting successfully, let’s visualize our data points from InfluxDB on a Grafana dashboard.
Navigate to the location of your Grafana interface on your browser. Using the default ports, it should be at http://localhost:3000
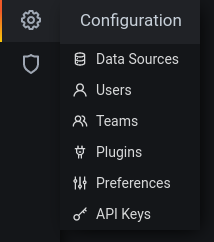
You can see Configuration on the left sidebar.
On the Configuration sidebar on the left, click on Data Sources and choose InfluxDB. As mentioned before, you’ll be able to see all the different databases that Grafana supports.
Fill in the required fields (if you initialized using the same information as me, then the following should be the same).
HTTP > URL: http://172.17.0.3:8086 (This URL gathered from Docker container itself. You can attach to the terminal via docker exec -it influxdb bash and check the IP address with hostname -I)
InfluxDB Details > Database: pings
InfluxDB Details > User: data
InfluxDB Details > Password: data
Hit Save & Test. If everything went well, there shouldn’t be any errors.
We’re almost done with our RRDtool – InfluxDB – Grafana stack. Lastly, create a dashboard by going to Dashboards > Manage from the left sidebar and add a panel.
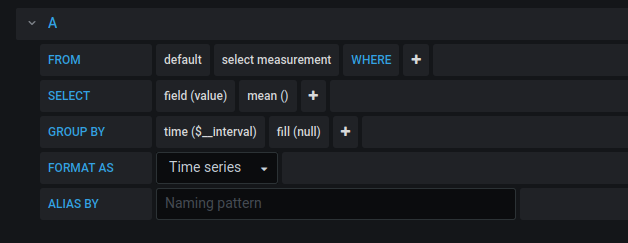
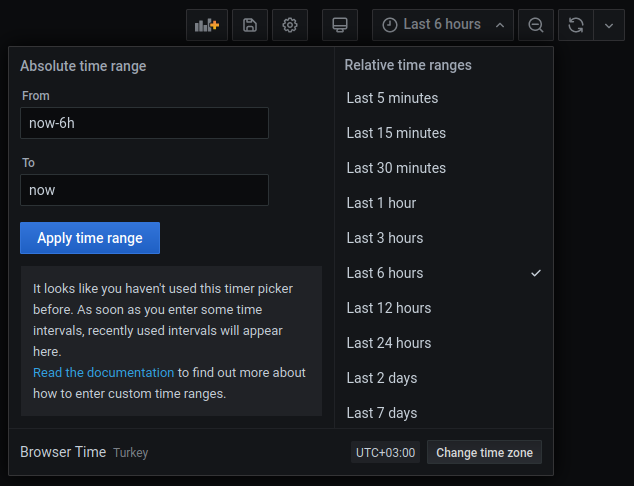
Select your query parameters (don’t forget to indicate your timezone)
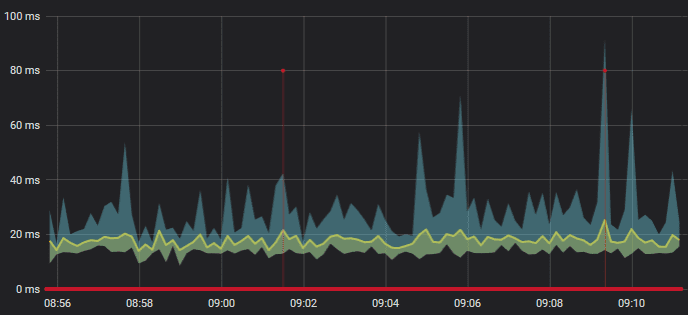
As you can see, the data comes from RRD files processed by a Python script and is then inserted to InfluxDB. From there, the InfluxDB data is shown on our Grafana dashboard we just made. If you want streamed data, you’ll need to set a cronjob to periodically run your Python script or daemonize your script via some time-related rules and Supervisord.
There is definitely room for improvement, but fundamentally this is how I approached my monitoring stack.
Additionally, I incorporated Tableau into this stack to generate reports and further visualization. I plan to write more about this in my next blog post, which may include more details from this post.
UPDATE: After sharing this post on Twitter, it was recognized by the official InfluxData account and that made me so proud.
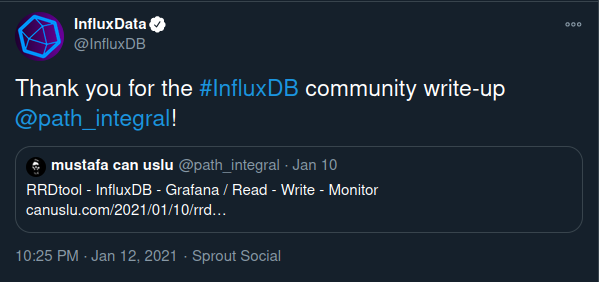
I’m glad to mention that this integration was
HI canuslu – This is great! I work here at InfluxData and I’d love to learn more about how you’re using InfluxDB.
Hello Caitlin, I’ve sent the details by e-mail and waiting impatiently to wear the cool hoodie.
Hi, great job. I would like to have access to more details as I am wanting to analyze the data collected by nfsen.
Hi, thanks for kind words. What’s on your mind? What kind of analyze are we talking about? with more details I’ll be glad to discuss.
Hi! great job on this blog. Finally I have managed to make sense of the information in the rrd files. I will check this python-rrd tool because I need to do exactly what you have managed to do. Thank you very much.
Hey! I’m so glad this post helped you with your RRD files. Thanks to Influx and Grafana, now we are able to monitor what’s going on with those rusty RRDs.
hello, I liked the reading, I have doubts about how you use python-rddtool to obtain the data from the rrd files, could you tell me how you did it, thanks and regards.
Hi, thanks for the comment. Actually, it’s pretty straightforward for anyone who wrote a few lines with Python. I used “fetch” method (https://pythonhosted.org/rrdtool/usage.html#fetch) on that project. It’s almost similar to using rrdtool from CLI. You pass the arguments (from timestamp, to timestamp, name of the RRD file, name of the ds, etc. ) to the fetch method and obtain the data you need.
I dropped an example code piece to below:
result = rrdtool.fetch(“test.rrd”, “AVERAGE”)
start, end, step = result[0]
ds = result[1]
rows = result[2]